
Somebody you follow is having the best day of their year.
A morning feed, from an account that follows about three hundred people. An engagement ring. A marathon under four hours. A new job title, a flat with a balcony, a child’s first steps filmed in good light. Nothing in it is invented, and every item is true of the person who posted it.
The feed still describes nobody’s life. Of three hundred people, most had an ordinary day yesterday, and ordinary days do not get posted. What arrives is the top of the distribution, sorted, every morning, from a pool large enough that the top is always extreme.
That second part is arithmetic and needs no psychology at all. Give every person in the circle exactly the same kind of life as the reader, let each of them post only the days worth posting, and see where the posted days land.
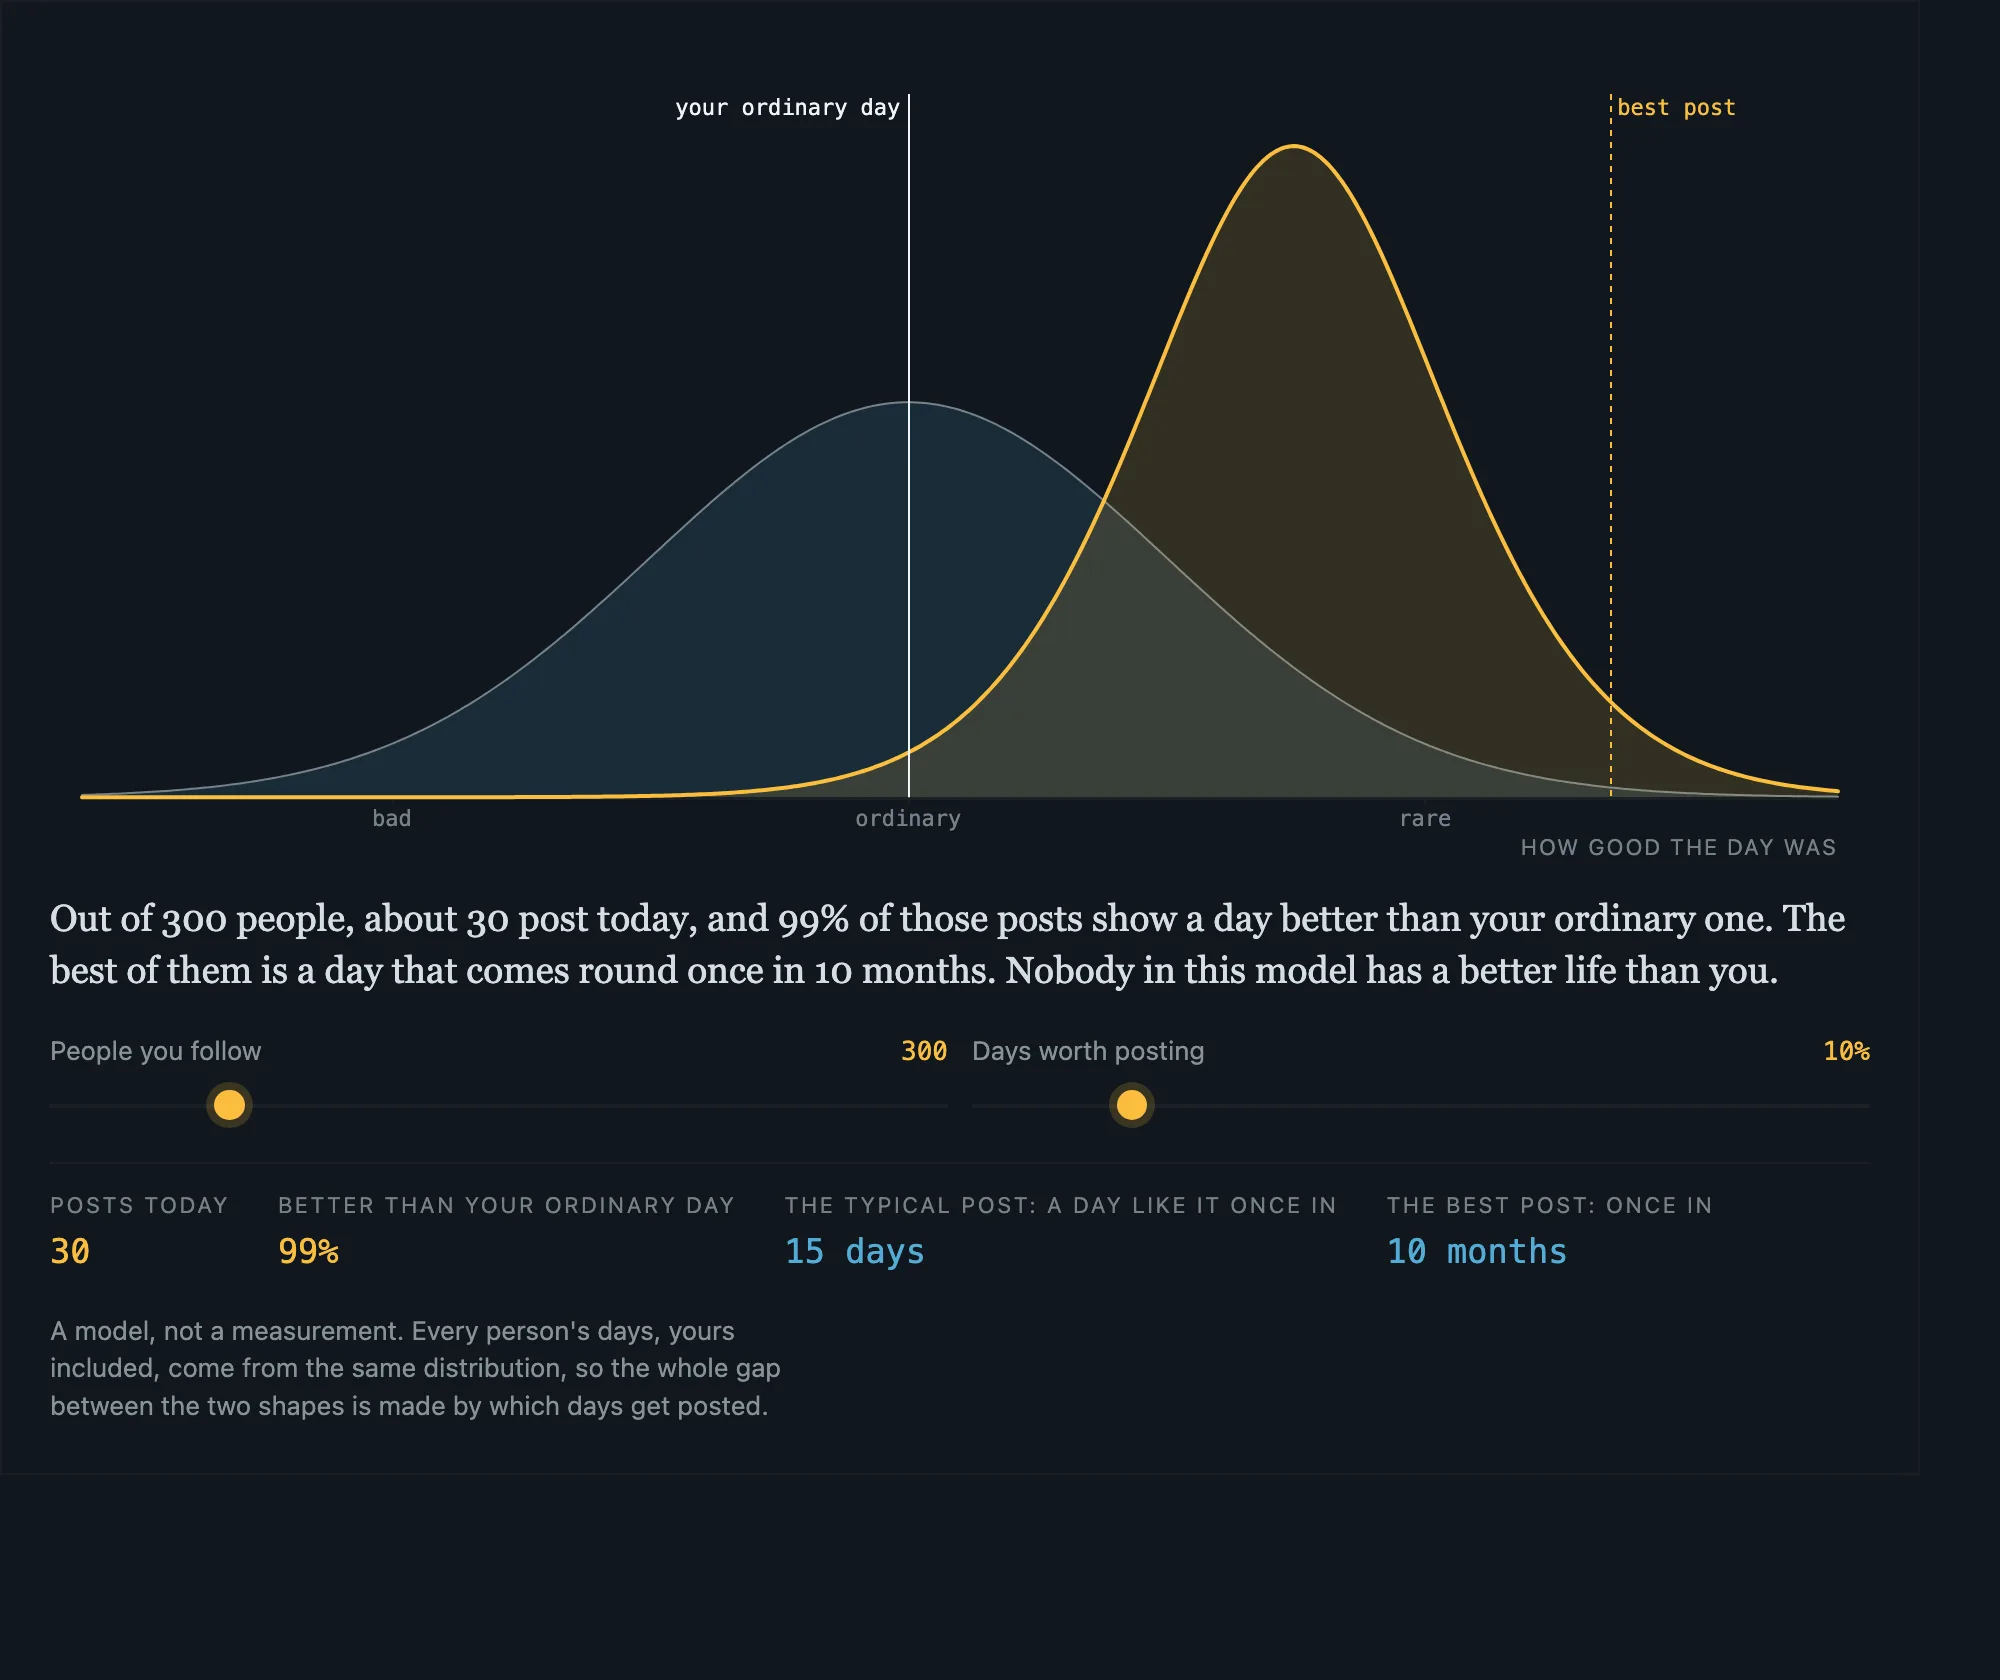
With three hundred people posting one day in ten, 99% of the feed shows a day better than an ordinary one. The typical post is a day that comes round once a fortnight. The best post is a day that comes round once in ten months, and it is there again tomorrow, from someone else.
Illustration generated with Google Gemini
The comparison
The reference group used to be a room.
People judge how they are doing by looking at others, and the idea is old enough to have a founding paper. Festinger proposed in 1954 that where no objective measure exists, people evaluate their abilities against the people around them, pick comparison targets who resemble them, and for abilities feel a steady pull to measure themselves against those a little ahead.
For most of history “the people around them” was a class, a street, a workplace, a few dozen faces whose bad days were as visible as their good ones. A feed replaces that group with hundreds of people, shows only their selected days, and removes every signal of what the selection threw away.
There is a structural version of the same distortion that needs no selection by the poster. On average, people’s friends have more friends than they do, a result Feld proved in 1991, because popular people sit in many circles and get counted in each of them. In a Twitter network of 39,110 users, 94.3% had fewer friends than their friends did, and 58.5% posted less cheerful language than the average of the accounts they followed back. That second figure measures the tone of tweets, not anyone’s actual happiness, and it is the version that circulates as “your friends are happier than you”.
The widget above is a model, and what it models is the part nobody disputes. Whether looking at that distribution every morning changes how a person feels is an empirical question, and it has a better answer than most of the argument about it suggests.
The evidence
The strongest studies find harm, and it is modest.
The cleanest test so far used history as the experiment. Facebook launched college by college between 2004 and 2006, so some campuses had it years before others. Matching that rollout against a national student health survey, access to Facebook worsened a mental health index by 0.085 standard deviations, with the largest rise in depression and anxiety.
The authors went looking for the mechanism, which the survey never measured, so they inferred it from who was hurt. The damage was larger for students living off campus, from poorer families, or outside fraternities and sororities, the students most likely to feel they were falling behind the people they now saw online. That pattern fits an unfavourable-comparison account, and a plain screen-time account does not predict it.
The second design pays people to stop. Before the 2018 US midterms, Facebook users paid to deactivate for four weeks reported higher subjective well-being, by 0.09 standard deviations, and got back about an hour a day. Weeks after the payments ended they were still using the Facebook app around eleven minutes a day less, by their own choice.
The same group repeated the design at a far larger scale before the 2020 election, with Meta paying for it and Meta staff among the authors. Six weeks without Facebook raised an emotional state index by 0.060 standard deviations. The Instagram arm reached 0.041, which did not survive the correction for multiple tests the authors had committed to in advance.
The comparison step itself has been tested directly, in the lab. Across 48 experiments that showed participants upward comparison content on social media and compared them with people shown neutral or downward content, self-evaluations and mood dropped by g = -0.24, and by -0.31 for body image. Those exposures lasted minutes, used mostly appearance content and mostly young women, and a correction for publication bias shrinks the estimate to about -0.18.
A further result explains part of why people stay. In a field experiment that gave phone users limits they could set on themselves, a model attributed 31% of use to self-control problems, meaning use the same people would have removed in advance if they could. The category behind that figure includes browsers and YouTube as well as social apps, so it describes compulsion on a phone more than comparison on a feed.
The opposition
Most of this could be smaller than it sounds, and here is who says so.
Across three large surveys of 355,358 adolescents, technology use explained at most 0.4% of the variation in well-being. The authors set it beside other variables in the same data: eating potatoes came out about as negative, and wearing glasses more negative still. It is correlational, and a small average can hide a large effect in a few people, but it sets the ceiling a population-wide claim has to live under.
Pooling 27 social media experiments, one meta-analysis found an average effect of d = 0.086 that could not be told apart from zero, and argued that participants in these designs can usually guess what is being tested. Its critics used the same data. Split by length, studies lasting a week or more showed a small significant benefit and shorter ones showed harm. A separate pool of 32 restriction trials, coded independently, reached g = 0.17, and its own authors call that support weak.
That dispute is live, and the weight of it favours a real but small average effect. That is my judgement rather than a consensus, and Ferguson’s point about guessable hypotheses applies to every experiment in the previous section.
The best reason to distrust the average cuts the other way. Sampling 63 Dutch fourteen- and fifteen-year-olds six times a day for a week, one study found that passive social media use left 46% feeling better, 44% no different and 10% worse. It is one school and one week, and an average of those three groups describes none of them.
The review that made the strongest public case against the moral panic, Odgers in Nature, does not call feeds harmless. It argues the evidence does not show they caused the rise in teenage mental illness, that earlier distress predicts later use more strongly than use predicts later distress, and it names other candidates, from economic hardship to one school psychologist for every 1,119 American students.
Two disclosures belong here rather than in a footnote. The college rollout, both deactivation experiments and the self-control study come from one group of economists around Allcott, Gentzkow and Braghieri, who benchmark their estimates against each other. When the college study calls its match with the deactivation estimate striking, that is one programme agreeing with itself. And the adolescent sampling study comes from the Amsterdam group whose wider work is the main source of the heterogeneity argument, so it is that group’s evidence for its own position.
What survives
The distortion is guaranteed. The damage is not.
The arithmetic holds for everyone. Any feed built from a few hundred people who post their better days will show a distribution that no individual life can match, and the size of the gap follows from the number of people and how selective they are, without anyone exaggerating anything.
What that gap does to a given person is far less certain. Estimates from whole platforms put the average cost at under a tenth of a standard deviation, and the lab puts a single dose of upward comparison at around a quarter of one. Both are real and both are small. The distribution around that average is wide, and some readers of this sentence sit in the tail that feels worse.
The experiments point at the lever they actually pulled, which was hours. Four weeks off returned about an hour a day, left people slightly happier, and left them using less afterwards by their own choice. Nobody in those studies was told to compare less. They were simply shown fewer other people’s best days.